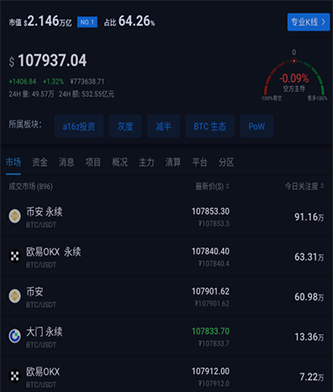
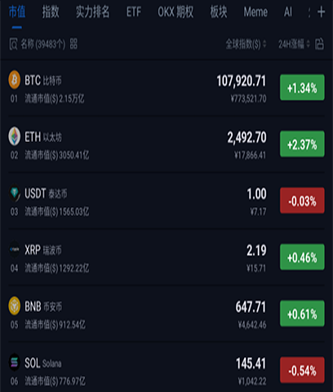
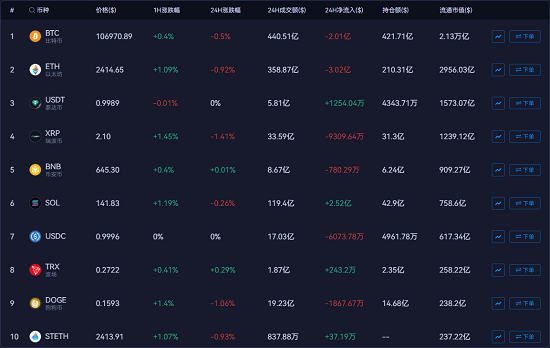
Track Bitcoin, Ethereum, and other digital assets with real-time prices, multi-exchange data, professional K-line charts, derivatives metrics, on-chain signals, market alerts, and crypto news across web, desktop, and mobile.
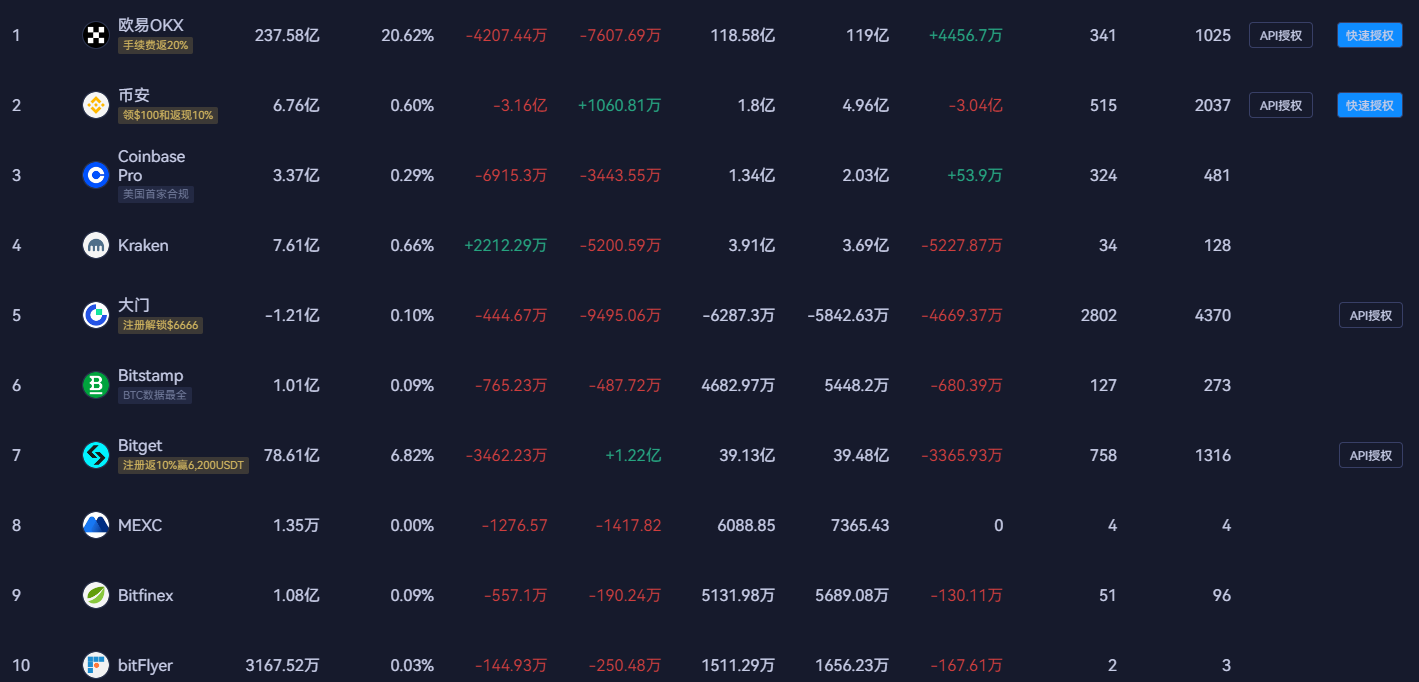
Compare spot and derivatives prices, trading pairs, volume, order books, and exchange-level market movement in one workspace.
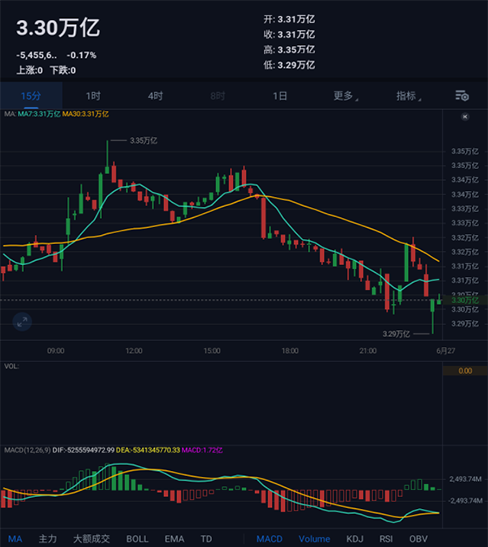
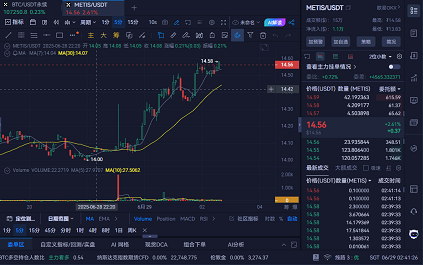
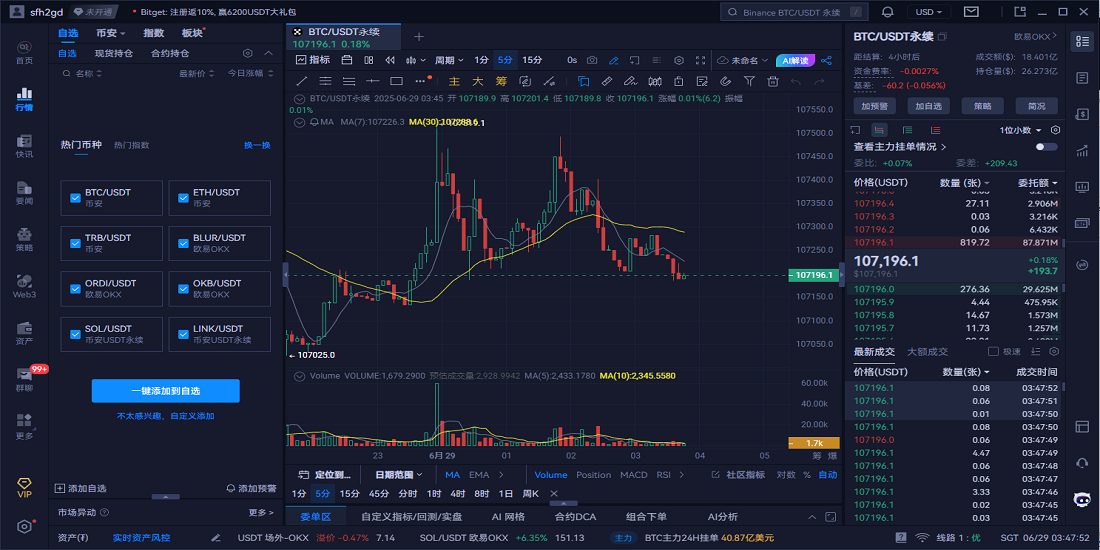
Study candlestick trends with multiple timeframes, drawing tools, technical indicators, saved layouts, and configurable market alerts.
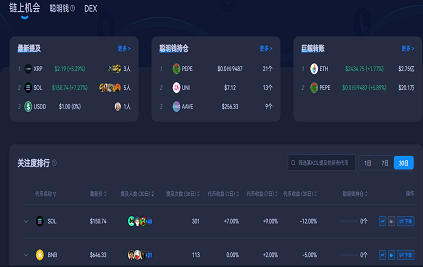
Monitor whale transfers, smart-money activity, token momentum, sector trends, funding data, and market events from one research view.
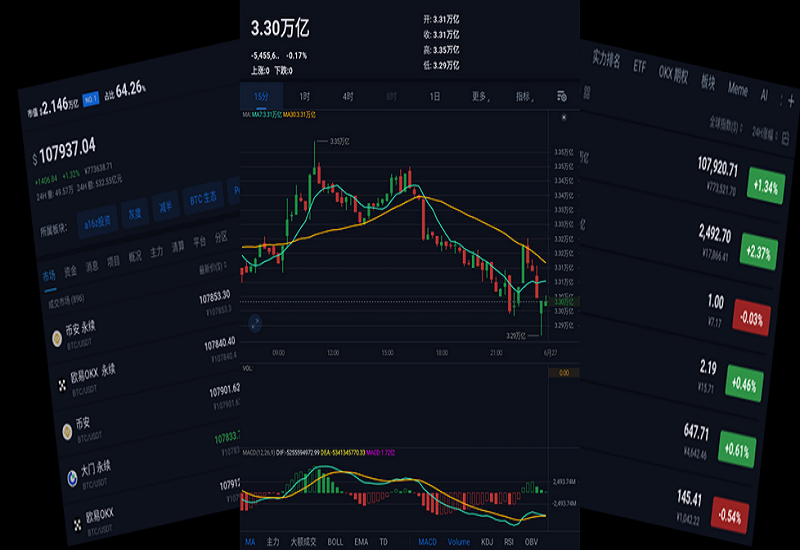
Compare prices, trading volume, order-book depth, and trading pairs across supported exchanges to review how the same asset behaves in different markets.
Use multi-timeframe K-line charts, drawing tools, and technical indicators to study Bitcoin, Ethereum, and other digital-asset price trends.
View several charts, watchlists, and markets at the same time to build a clearer workspace for cross-asset and cross-timeframe analysis.
Review perpetual contracts, funding rates, spot-futures spreads, and related metrics to observe leverage conditions and changes in market positioning.
Set alerts for price levels, percentage moves, volume, or indicator conditions to follow breakouts, pullbacks, and fast market changes.
Start with prices, market capitalization, percentage change, exchange markets, and basic charts before moving into deeper indicators and Web3 data.
Connect supported accounts or API access points to review several markets in one interface and use available tools within the granted permissions.
Save chart layouts, switch indicators, and keep markets visible in Windows or macOS clients for desktop research, monitoring, and review.
Use mobile access to review watchlists, price changes, and selected alerts when you are away from your primary desktop workspace.
Combine market news, project updates, rankings, and community discussion with live prices to understand the events behind market movement.
Save trend lines, support and resistance levels, chart notes, and indicator settings to create reusable analysis layouts.
Compare historical K-line data, indicator conditions, and signal behavior to study market patterns and review trading ideas without implying future results.
Review price, volume, and indicator changes across different periods to compare trends, ranges, breakouts, and shifts in market structure.
Access market data through web, Windows, macOS, Android, iOS, and iPad entry points so watchlists and research fit different devices.
Create price, percentage-change, and volatility conditions for selected assets to follow Bitcoin, Ethereum, and active market sectors.
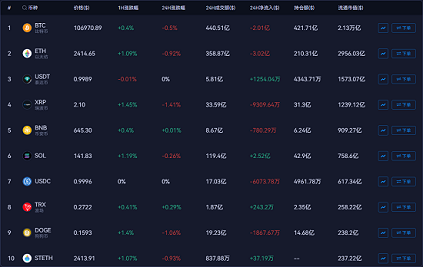
Use market-cap, gainers, losers, volume, and themed rankings to identify active cryptocurrencies and sectors for further research.
Combine charts, drawing tools, technical indicators, and alerts in a continuous process from market observation to later review.
Bring real-time prices, professional charts, derivatives data, on-chain activity, market news, and alerts into one research workspace.
Compare historical charts, indicator signals, and market data across different periods to create observable evidence for strategy research.
Use industry news, market flashes, and community content as context, then compare those views with actual price, volume, and on-chain changes.